
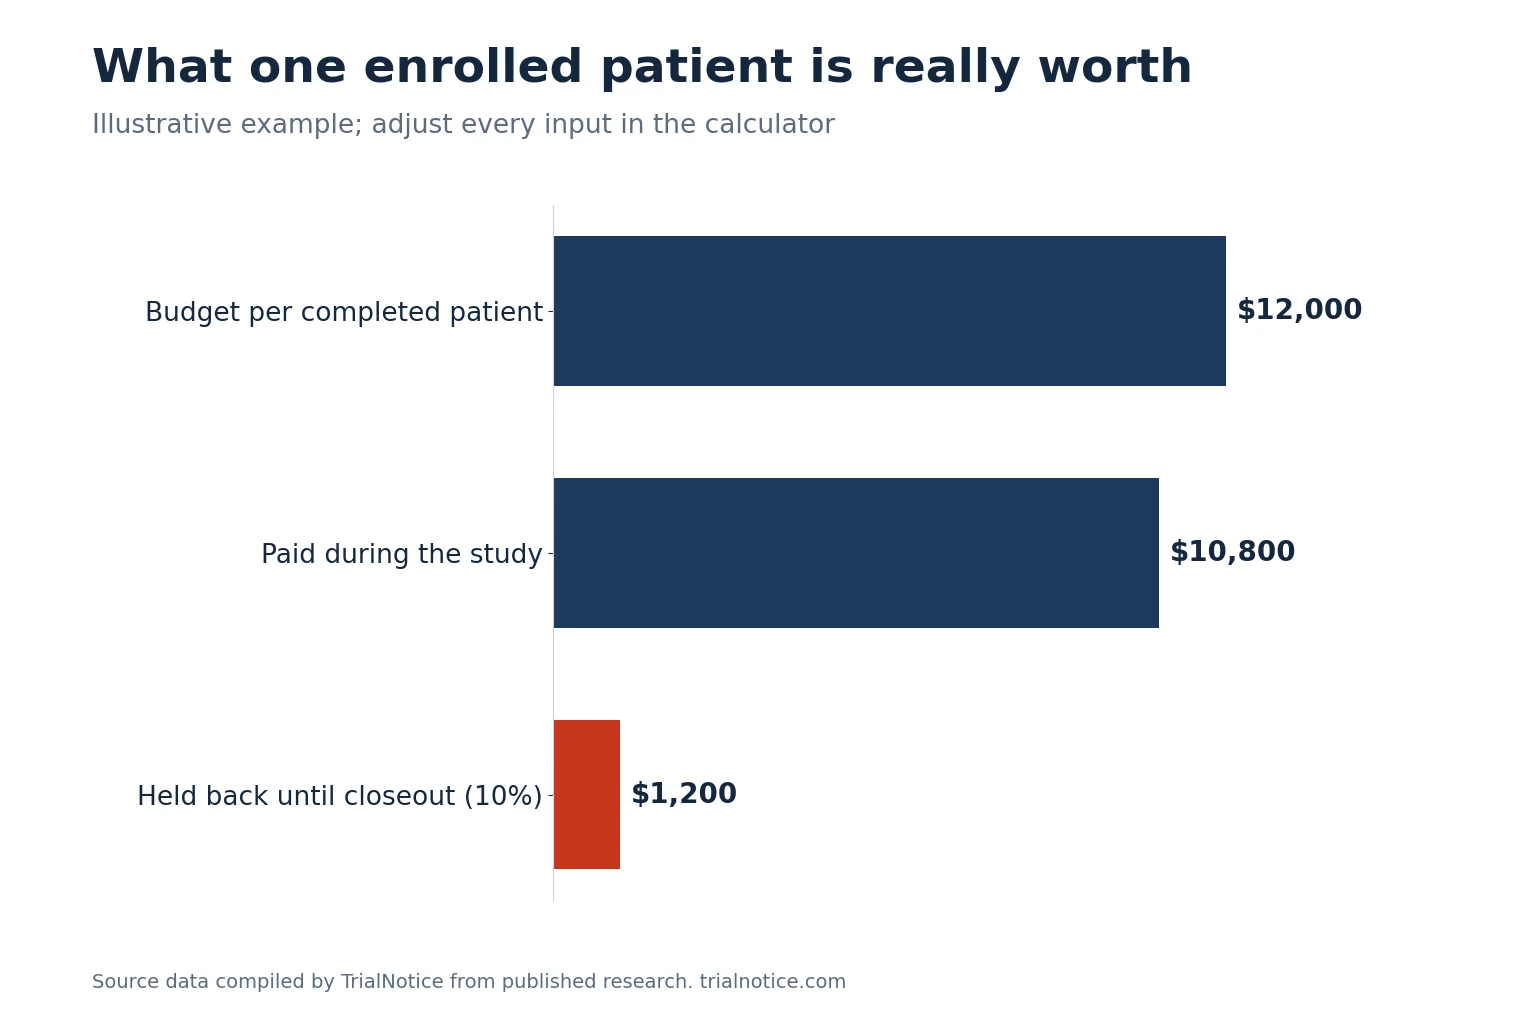
Short answerRevenue per enrolled patient is the study budget per completed patient, adjusted for the chance a patient drops out before finishing and for how much is held back until closeout. Use the calculator below with your own budget grid. The Tufts CSDD average dropout rate of 19.1% is the starting default.
Revenue per patient calculator
All defaults are illustrative. Use your actual budget grid.
Where do the defaults come from?
- Dropout: the Tufts CSDD Phase II and III average is 19.1% (Tufts CSDD).
- Holdback: the most common holdback in SCRS's 2023 survey was 10% to 14% of earned revenue (IntuitionLabs, citing SCRS), and Penn's guidance caps it at 10% (Penn Medicine). Holdback delays cash; it is not lost.
- Share lost on dropout: most budgets pay per completed visit, so a patient who drops midway still earns part of the budget. 50% is a neutral starting point.
Why does this number matter?
It tells you what one more enrolled patient is worth, which is the right ceiling for what you can spend to find one. SCRS reports 38% of sites saw profits decline in 2023 (SCRS); knowing this number per study is how sites decide where recruitment money pays back. Try it alongside the recruitment ROI calculator.
Get your study in front of the right local physicians
TrialNotice builds a physician referral pipeline around one active study. We identify relevant local physicians within driving distance of your site, send study aligned direct mail, follow up by email and LinkedIn, track engagement with recipient level QR codes, and route warm responses into your site team's workflow.
Talk to TrialNoticeSources
- Applied Clinical Trials, "Can Recruitment and Retention Get Any Worse?" (Tufts CSDD screen failure study)
- IntuitionLabs, "Clinical Trial Site Payment Benchmarks 2026" (citing the SCRS 2023 Site Landscape Survey)
- University of Pennsylvania Perelman School of Medicine, Budget Preparation and Development
- Society for Clinical Research Sites, Site Finances White Paper (2024)