Benchmarks and tools

Clinical trial enrollment statistics: the complete reference

Research site manager looking at a monitor showing an enrollment bar chart falling below a red target line
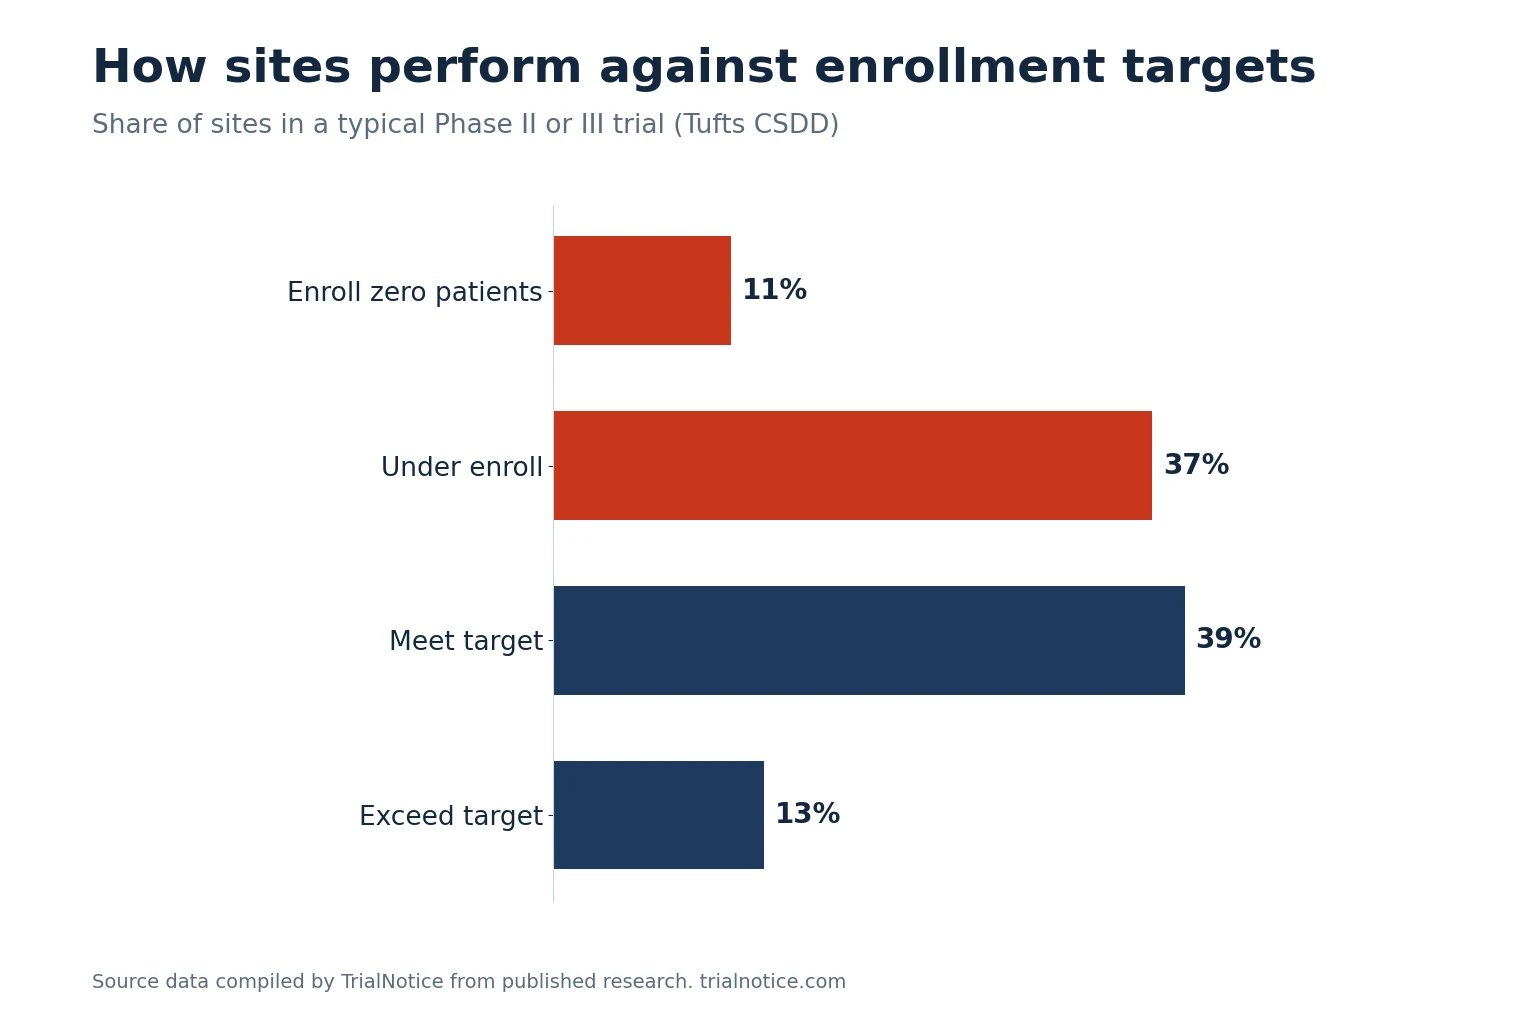
Short answerIn a typical Phase II or III trial, 11% of sites enroll no patients, 37% under enroll, 39% meet their target, and 13% exceed it, according to Tufts CSDD. The average screen failure rate is 36.3% and the average dropout rate is 19.1%. Only 62% of North American sites that sponsors engage go on to activate.
Bar chart showing 11% of sites enroll zero patients, 37% under enroll, 39% meet target, and 13% exceed target

This page collects the enrollment statistics we cite across the TrialNotice blog, each traced to its primary or most authoritative source. We update it as new research is published.

How do sites perform against enrollment targets?

StatisticFigureSource
Sites that enroll zero patients in a typical trial11%Tufts CSDD
Sites that under enroll37%Tufts CSDD
Sites that meet their target39%Tufts CSDD
Sites that exceed their target13%Tufts CSDD
North American sites that enroll zero patients13%Applied Clinical Trials
Change in the zero enrollment share over 20 yearsNone, per Ken GetzClinical Leader

How concentrated is enrollment?

StatisticFigureSource
Sites contributing less than 3% of patients (173 cancer trials)19% of sitesPhesi
Share of patients from the top 16% of sites54%Phesi
Cost to a sponsor of a site enrolling one patient over 30 monthsAbout $130,000Phesi

What happens between screening and completion?

StatisticFigureSource
Average screen failure rate, Phase II and III36.3%Tufts CSDD
Average screen failure rate, CNS trials57%Tufts CSDD
Average dropout rate, Phase II and III19.1%Tufts CSDD

How have protocols and timelines changed?

StatisticFigureSource
North American site activation rate62%Tufts CSDD via Clinical Trial Vanguard
Eligibility criteria in a typical Phase III protocol, 2002 vs 201231 to 50Tufts CSDD
Increase in total procedures vs 10 years ago61%SCRS 2025 via Clinical Leader
Increase in total endpoints vs 10 years ago29%SCRS 2025 via Clinical Leader
Sites that declined a trial due to complexity24%SCRS 2025 via Clinical Leader
Average delay for trials running lateAbout six weeksGetz, Applied Clinical Trials

What do these numbers mean for a site?

Read together, the data says enrollment problems are structural, not personal. Protocols are harder to fill, activation is slower, and a minority of sites deliver most patients. The sites in that top group have one thing in common: more than one reliable source of eligible patients. The most underused source is local physicians, who refer less than 0.2% of their patients into trials today. See physician referral statistics.

Get your study in front of the right local physicians

TrialNotice builds a physician referral pipeline around one active study. We identify relevant local physicians within driving distance of your site, send study aligned direct mail, follow up by email and LinkedIn, track engagement with recipient level QR codes, and route warm responses into your site team's workflow.

Talk to TrialNotice

Sources

  1. Tufts CSDD, patient recruitment and retention practices study (Jan 2013), via Fierce Biotech
  2. Applied Clinical Trials, "Enrollment Performance: Weighing the Facts"
  3. Clinical Leader, "Why Is Study Start Up Still So Inefficient?" (interview with Ken Getz, Tufts CSDD)
  4. Applied Clinical Trials, "Phesi Report: Assessing Single Patient Investigator Sites in Cancer Clinical Trials"
  5. Applied Clinical Trials, "Can Recruitment and Retention Get Any Worse?" (Tufts CSDD screen failure study)
  6. Clinical Trial Vanguard, "Tufts CSDD: New Insights on The Clinical Trial Industry" (SCOPE 2024)
  7. Ken Getz, Tufts CSDD, "The Cost of Clinical Trial Delays" (CTTI presentation)
  8. Clinical Leader, "Endpoints, Procedures, And Deviations Are On The Rise" (2025 SCRS Landscape Survey Report)
  9. Getz K., "Is Investigative Site Feasibility Feasible?" Applied Clinical Trials